Cette page est uniquement destinée à des fins d'information. Certains services et fonctionnalités peuvent ne pas être disponibles dans votre juridiction.

Crypto technical analysis: your essential guide to reading crypto data

Though technical analysis in the cryptocurrency market might seem daunting, the term simply refers to the study of past market data in an effort to project future price movements. In essence, it allows us to make educated guesses about whether a digital asset’s price will increase or decrease in the future.

In this article, we will briefly explain the most essential tools for conducting basic technical analysis in an effort to start you on your journey to charting BTC and other cryptocurrencies and up your crypto trading game.

Candlestick charts

Though there are different kinds of charts — such as line charts and bar charts — candlestick charts are one of the most effective.

Originating in Japan over a century ago, candlestick charts visually display the size of price moves in different colors — frequently green for a positive candle and red for a negative candle. 

Each candlestick displays four critical components for the desired time frame:

  • Open price
  • High price
  • Low price
  • Close price

Each candlestick displays four crucial pieces of information, with a “hollow” candle indicating a price increase

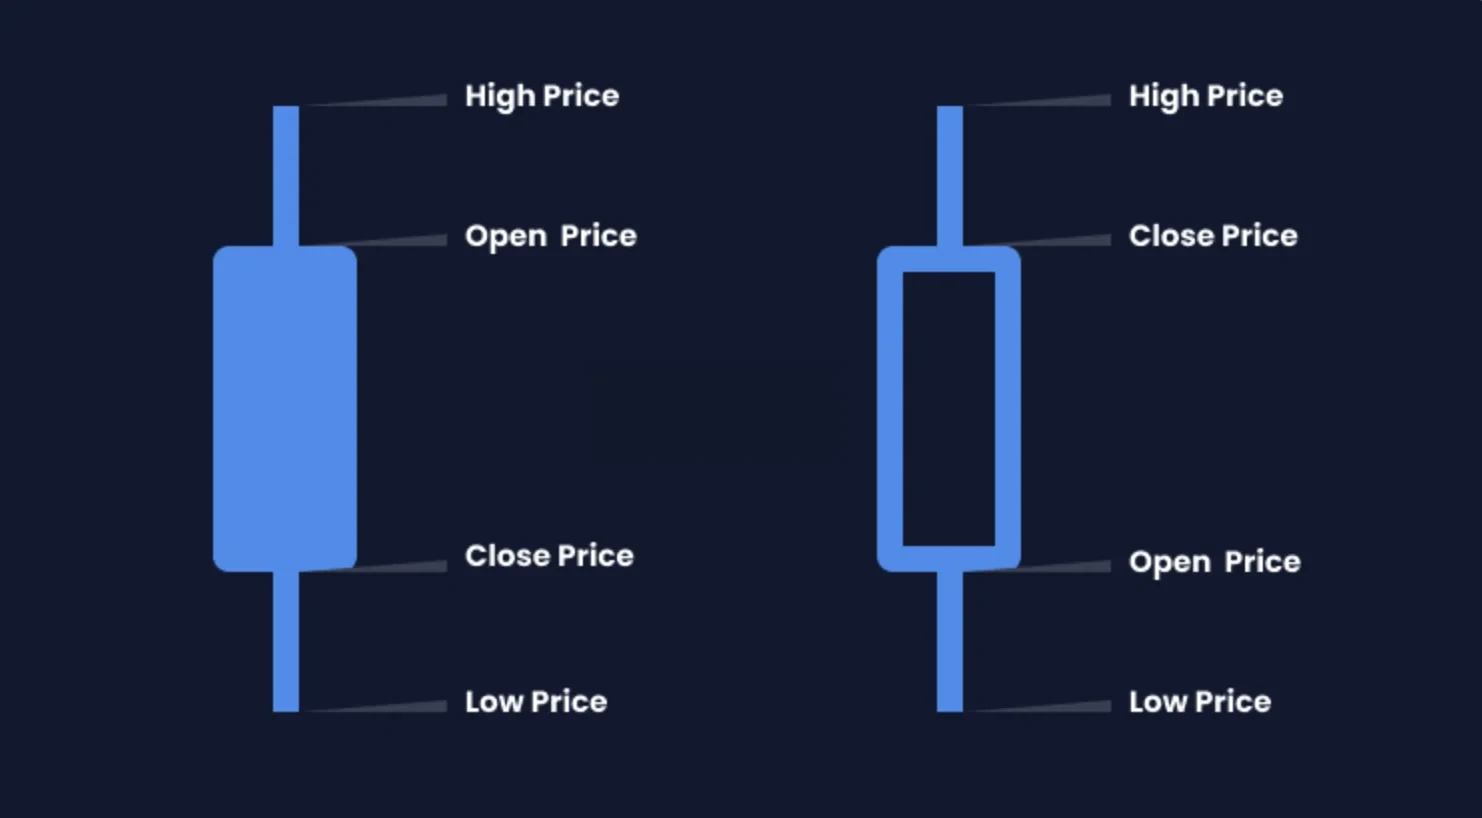
These components not only provide a plethora of useful information in an easy-to-read and concise format, but they also allow for the identification of various candlestick patterns. While there are a lot of candlestick patterns that we will not detail here, some simple ones include bullish and bearish engulfing patterns.

A bullish engulfing candlestick pattern, which shows a positive candle’s body “engulf” one or more preceding negative candles

Support and resistance

One of the most simple and effective methods of conducting technical analysis is to identify areas of support and resistance — where a digital asset’s price is expected to stop decreasing or stop increasing, respectively.

Because the cryptocurrency market is simply an exchange between buyers and sellers, it stands to reason that demand for a digital asset increases as its price decreases, and vice versa — at least, in theory. This essential principle is largely responsible for creating both levels of support and resistance. Simply put, the market often has an interest in buying or selling at a certain price, which creates levels that are difficult to break through.

The price of BTC from late 2017 to late 2018 bounced off of a horizontal support level approximately six times before eventually falling through

Identifying key levels of support and resistance may be useful in planning trades. For example, the more times a level of support or resistance is tested, the weaker it tends to become. A prime example of this is illustrated above — when the price of BTC ultimately collapsed through its near-year-long support level of roughly $6,000 in 2018.

Trend lines

Another basic technical analysis tool that is of critical importance is the trend line — which, as the name implies, is a line that is used to identify a trend. 

By tracing the tops or bottoms of candlestick patterns, a technical analyst may identify a clear bullish or bearish trend for the price of a cryptocurrency and adjust their trading strategy accordingly.

BTC trended downward for an extended period of time in the second half of 2019 before firmly breaking through the downward sloping trend line — which was recycled as support during the COVID-induced market crash in March 2020

Moving averages

Moving averages are a popular and easy-to-use lagging indicator that smoothes out price volatility and paints a clearer picture of what a digital asset’s average price is over a specified period of time. 

There are two primary types of moving averages:

  • Simple moving averages
  • Exponential moving averages

Simple moving averages use the arithmetic mean of a set of prices, while exponential moving averages give recent price action more weight.

Moving averages may be used alone or in conjunction with each other. For example, we often use a ribbon of exponential moving averages on the four-hour candlestick chart in our Crypto Market Daily analyses. This ribbon consists of eight EMAs, ranging from 20 to 55 in increments of five — meaning it takes the average of the past 20 to 55 candlesticks while putting more weight on recent price activity.

The four-hour EMA ribbon for BTC has acted as support many times throughout late 2020 and clearly identified a bull trend

In trending markets, the EMA ribbon may prove useful, as it clearly illustrates in which direction a market is trending and where areas of support or resistance may be found.

Relative strength index

The final tool we will discuss in this article is the Relative Strength Index, which is a momentum indicator that is primarily used to identify whether or not a cryptocurrency is overbought or oversold. Traditionally, RSI values over 70 indicate that a digital asset is overbought and values under 30 indicate that it is oversold.

However, when it comes to BTC and other cryptocurrencies, the RSI may not be the most reliable indicator. BTC has proven that it is prone to extended bull runs that see its price repeatedly become, and often stay, overbought. Nevertheless, it may be useful for identifying when a pullback could be on the horizon.

During BTC’s bull run through 2016–2017, the market-leading cryptocurrency repeatedly became overbought on the weekly time frame

If you’re ready to level up with more advanced cryptocurrency technical analysis, check out our latest Learn articles.

Avis de non-responsabilité
Ce contenu est uniquement fourni à titre d’information et peut concerner des produits indisponibles dans votre région. Il n’est pas destiné à fournir (i) un conseil en investissement ou une recommandation d’investissement ; (ii) une offre ou une sollicitation d’achat, de vente ou de détention de cryptos/d’actifs numériques ; ou (iii) un conseil financier, comptable, juridique ou fiscal. La détention d’actifs numérique, y compris les stablecoins et les NFT, comporte un degré élevé de risque, et ces derniers peuvent fluctuer considérablement. Évaluez attentivement votre situation financière pour déterminer si vous êtes en mesure de détenir des cryptos/actifs numériques ou de vous livrer à des activités de trading. Demandez conseil auprès de votre expert juridique, fiscal ou en investissement pour toute question portant sur votre situation personnelle. Les informations (y compris les données sur les marchés, les analyses de données et les informations statistiques, le cas échéant) exposées dans la présente publication sont fournies à titre d’information générale uniquement. Bien que toutes les précautions raisonnables aient été prises lors de la préparation des présents graphiques et données, nous n’assumons aucune responsabilité quant aux erreurs relatives à des faits ou à des omissions exprimées aux présentes.

© 2025 OKX. Le présent article peut être reproduit ou distribué intégralement, ou des extraits de 100 mots ou moins du présent article peuvent être utilisés, à condition que ledit usage ne soit pas commercial. Toute reproduction ou distribution de l’intégralité de l’article doit également indiquer de manière évidente : « Cet article est © 2025 OKX et est utilisé avec autorisation. » Les extraits autorisés doivent être liés au nom de l’article et comporter l’attribution suivante : « Nom de l’article, [nom de l’auteur le cas échéant], © 2025 OKX. » Aucune œuvre dérivée ou autre utilisation de cet article n’est autorisée.

Articles connexes

Afficher plus
golpe de investimento
Security

What crypto romance scams are and how to avoid them

Romance scams have been around for some time, and now often use crypto as their means of defrauding victims. This is a form of confidence trick that involves a scammer faking romantic intentions with the victim. The aim is to create an emotionally intimate relationship to persuade the victim to hand over their money, digital assets, or personal information.
31 mars 2025
Débutant
52
Options trading generic thumb
Options
Strategies

Option expiration dates: what happens when options expire?

Have you seen 'DTE' while scrolling through social media and wondered what it means? DTE, or 'days to expiry,' indicates how long remains before an option contract expires. Curious how expiration dates affect option premiums and impact your trading strategy? Whether you're new to options trading or curious about the nuances of crypto markets, this guide will provide you with all the information you need to navigate expiration dates confidently. From explaining what options expiration dates are to understanding what happens when options expire, here's everything you need to know about crypto option expiration dates.
15 oct. 2024
Intermédiaire
4
Generic charts thumbnail
Strategies
Market Updates

Crypto and rate hikes: why Fed meetings impact crypto prices

Known for its volatility and unpredictability, the crypto market can sometimes feel like a rollercoaster ride even for veteran crypto traders. Amid the ups and downs, there's one factor that often impacts said volatility and often flies under the radar: the U.S. Federal Reserve (also known as the 'Fed') and its interest rate decisions. As much as crypto enthusiasts will say crypto is detached from the realm of traditional finance (TradFi), what happens in these government meetings can technically have a sizable impact on the price of your favorite cryptocurrencies.
28 avr. 2025
Intermédiaire
3
Technical analysis generic thumb
Technical analysis
Strategies

The ultimate guide to understanding and trading bear flag patterns

With the crypto market being inherently volatile, crypto traders will need any edge they can get to achieve long-term success in the crypto space. That’s why recognizing and trading based on chart patterns like bear flags is so essential if you’re actively trading in the crypto markets. As one of the more recognizable multi-candle chart patterns used by crypto traders, bear flag patterns are powerful indicators of potential price movement, and can be helpful for any trader who spots a consolidation phase.
24 avr. 2025
Débutant
13
Top Bitcoin DeFi projects
DeFi
DEX

What is Maximal Extractable Value: how MEV impacts DeFi swaps

For those venturing into the exciting yet intricate world of cryptocurrency, understanding Maximal Extractable Value (MEV) is important. While seemingly obscure and abstract, MEV has a huge impact on transaction processing. This is particularly the case within like , where the impact of MEV can directly affect a user's experience. Whether you're a seasoned trader making lightning-fast swaps or a curious newcomer dipping your toes into the DeFi pool, understanding MEV extraction strategies and their potential impact can be crucial.
25 avr. 2024
Intermédiaire
1
OKXSignalTrading
Smart Trading

Signal trading 101: top 10 crypto indicators to keep an eye on

Whether you’re  new to crypto trading  or a seasoned vet, having the right tools in your trading arsenal is essential. Signal trading in crypto provides a data-driven approach to making decisions on buying or selling. These signals are generated based on market conditions, indicators, and analysis, which can help you navigate and explore digital assets to trade.
25 avr. 2024
5
Afficher plus